ER Diagram
What is an ER diagram?
The ER model defines the conceptual view of a database. It works around real-world entities and the associations among them. At view level, the ER model is considered a good option for designing databases.
An Entity Relationship Diagram (ERD) is a visual representation of different entities within a system and how they relate to each other. For example, the elements writer, novel, and a consumer may be described using ER diagrams the following way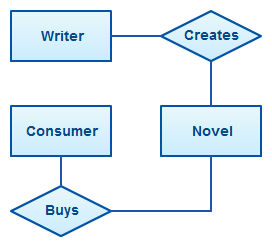
ER Diagram Symbols and Notations

ER Diagrams Usage
What are the uses of ER diagrams? Where are they used? Although they can be used to model almost any system they are primarily used in the following areas.ER Models in Database Design
They are widely used to design relational databases. The entities in the ER schema become tables, attributes and converted the database schema. Since they can be used to visualize database tables and their relationships it’s commonly used for database troubleshooting as well.ER diagrams in software engineering
Entity relationship diagrams are used in software engineering during the planning stages of the software project. They help to identify different system elements and their relationships with each other. It is often used as the basis for data flow diagrams or DFD’s as they are commonly known.
For example, an inventory software used in a retail shop will have a database that monitors elements such as purchases, item, item type, item source and item price. Rendering this information through an ER diagram would be something like this:

Entity
Entities are represented by means of rectangles. Rectangles are named with the entity set they represent.
Weak Entity
A weak entity is an entity that depends on the existence of another entity. In more technical terms it can be defined as an entity that cannot be identified by its own attributes. It uses a foreign key combined with its attributed to form the primary key. An entity like order item is a good example for this. The order item will be meaningless without an order so it depends on the existence of the order.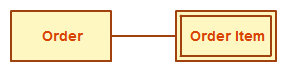
Attribute
Attributes are the properties of entities. Attributes are represented by means of ellipses. Every ellipse represents one attribute and is directly connected to its entity (rectangle).
Derived Attribute
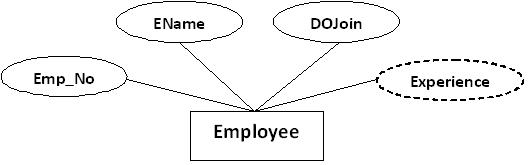
If the attributes are composite, they are further divided in a tree like structure. Every node is then connected to its attribute. That is, composite attributes are represented by ellipses that are connected with an ellipse.

Multivalued Attribute
If an attribute can have more than one value it is called a multi valued attribute. It is important to note that this is different to an attribute having its own attributes. For example, a teacher entity can have multiple subject values.
Relationship
Relationships are represented by diamond-shaped box. Name of the relationship is written inside the diamond-box. All the entities (rectangles) participating in a relationship, are connected to it by a line.
Recursive Relationship
If the same entity participates more than once in a relationship it is known as a recursive relationship. In the below example an employee can be a supervisor and be supervised, so there is a recursive relationship
Cardinality and Ordinality
These two further defines relationships between entities by placing the relationship in the context of numbers.Relationship
Relationships are represented by diamond-shaped box. Name of the relationship is written inside the diamond-box. All the entities (rectangles) participating in a relationship, are connected to it by a line.Binary Relationship and Cardinality
A relationship where two entities are participating is called a binary relationship. Cardinality is the number of instance of an entity from a relation that can be associated with the relation.- One-to-one − When only one instance of an entity is associated with the relationship, it is marked as '1:1'. The following image reflects that only one instance of each entity should be associated with the relationship. It depicts one-to-one relationship.
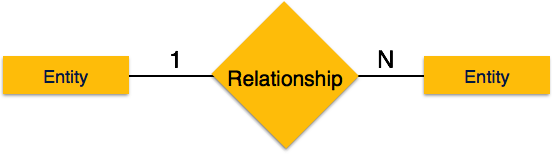
- One-to-many − When more than one instance of an entity is associated with a relationship, it is marked as '1:N'. The following image reflects that only one instance of entity on the left and more than one instance of an entity on the right can be associated with the relationship. It depicts one-to-many relationship.
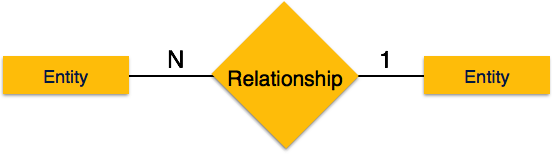
- Many-to-one − When more than one instance of entity is associated with the relationship, it is marked as 'N:1'. The following image reflects that more than one instance of an entity on the left and only one instance of an entity on the right can be associated with the relationship. It depicts many-to-one relationship.
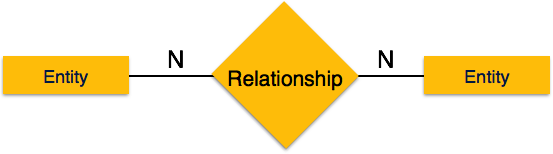
- Many-to-many − The following image reflects that more than one instance of an entity on the left and more than one instance of an entity on the right can be associated with the relationship. It depicts many-to-many relationship.

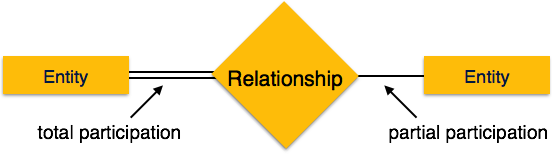
Participation Constraints
Total Participation − Each entity is involved in the relationship. Total participation is represented by double lines.- Partial participation − Not all entities are involved in the relationship. Partial participation is represented by single lines.